How to Visualize Global Shift Coverage Across Time Zones
Think your global team is covered 24 hours? Learn how to visualize shift coverage, detect hidden gaps, and prevent costly handover failures.
Managing a distributed team across multiple time zones is now standard for support, operations, and service organizations. What is not standard is having real visibility into coverage.
Most companies believe they are covered around the clock. Very few can actually prove it.
If you run 24 hour operations, you should be able to answer instantly:
- Who is active right now globally
- Where shifts overlap
- Where coverage gaps exist
- Whether customer peak hours are fully staffed
- How transitions between regions are handled
If answering those questions requires opening a spreadsheet, you are operating on assumptions.
If you are building a distributed support structure across multiple regions, it helps to first understand the fundamentals of the follow-the-sun support model and how it is supposed to work in theory.
This guide explains why global shift coverage is hard to see, how to visualize it correctly, and how to detect operational risk before it turns into an incident.
Why Global Shift Coverage Is Difficult to See
On paper, global coverage looks simple. You have a team in EMEA, a team in AMER, and a team in APAC. Together they cover 24 hours.
In reality, coverage breaks down because of five common blind spots.
1. Local Time Planning
Teams plan schedules in local time. Berlin plans in CET. New York plans in EST. Manila plans in PHT.
When you combine those schedules, confusion appears. Daylight savings shifts in one region but not another. A one hour mistake can create an uncovered window without anyone noticing.
2. Spreadsheets Hide Micro Gaps
Spreadsheets list names and hours. They do not show risk.
A 15 minute uncovered window during a shift change will not jump out at you in a table. On a visual timeline, it is obvious.
Micro gaps are small but dangerous. They are often where SLA breaches begin.
3. No Clear Overlap Windows
Many global teams run consecutive shifts instead of overlapping shifts.
If one team logs off at 17:00 and the next logs on at 17:00, you have zero tolerance for delay. If someone logs off early or logs on late, coverage disappears.
Without visualizing overlap buffers, transitions are fragile.
4. Skill Mismatch
Coverage is not just about headcount. It is about capability.
You may have three agents online, but none of them may be certified to handle a critical escalation. From a spreadsheet perspective, you are covered. From an operational perspective, you are exposed.
5. Customer Window Misalignment
Many organizations cover 24 hours because it sounds comprehensive. They do not align staffing with actual customer demand.
You might be fully staffed when customers are asleep and under staffed when demand spikes.
Without visualization, this misalignment stays hidden.
What Proper Global Shift Coverage Visualization Looks Like
If you manage distributed operations, you need to see coverage as a system, not a list.
A proper global shift coverage view should allow you to instantly understand five things.
1. Active Coverage by Region
You should see which regions are online at any given moment. This includes current coverage and future coverage across the day.
The key question is simple. If an incident happens right now, who owns it?
2. Overlap Windows
Healthy global operations include deliberate overlap between regions.
At least 30 to 60 minutes of simultaneous coverage allows teams to:
- Conduct live handovers
- Review priority tickets
- Transfer context
- Confirm queue status
A visual timeline makes overlap visible and measurable.
When overlap is poorly designed, it often leads to hidden inefficiencies and unnecessary payroll waste.
3. Uncovered Windows
White space on a timeline is risk.
Even short uncovered windows during shift transitions, lunch breaks, or daylight savings adjustments can create response delays.
Coverage visualization should clearly highlight those gaps so they can be corrected.
4. Customer Time Alignment
You should be able to overlay customer operating hours with team coverage.
If your largest customer base is active between 08:00 and 18:00 local time, your staffing should reflect that. Visualization allows you to test that alignment instantly.
5. A Single Time Anchor
All regions should be anchored to one reference time, typically UTC.
This prevents daylight savings confusion and ensures that multi region coverage is mathematically sound.
Without a unified time reference, global scheduling becomes guesswork.
A Practical Example
Imagine you operate with teams in New York, Berlin, and Manila.
In a spreadsheet, you might see three blocks of coverage that appear to fill the day.
On a visual timeline, you may discover:
- A 20 minute gap between Berlin signing off and New York logging on
- No certified escalation owner during the Manila shift
- Two hours of unnecessary overlap where staffing exceeds demand
- Under coverage during peak North American ticket volume
These issues are difficult to detect in static tables. They are obvious when displayed on a global coverage map.
Visualization turns assumptions into measurable data.
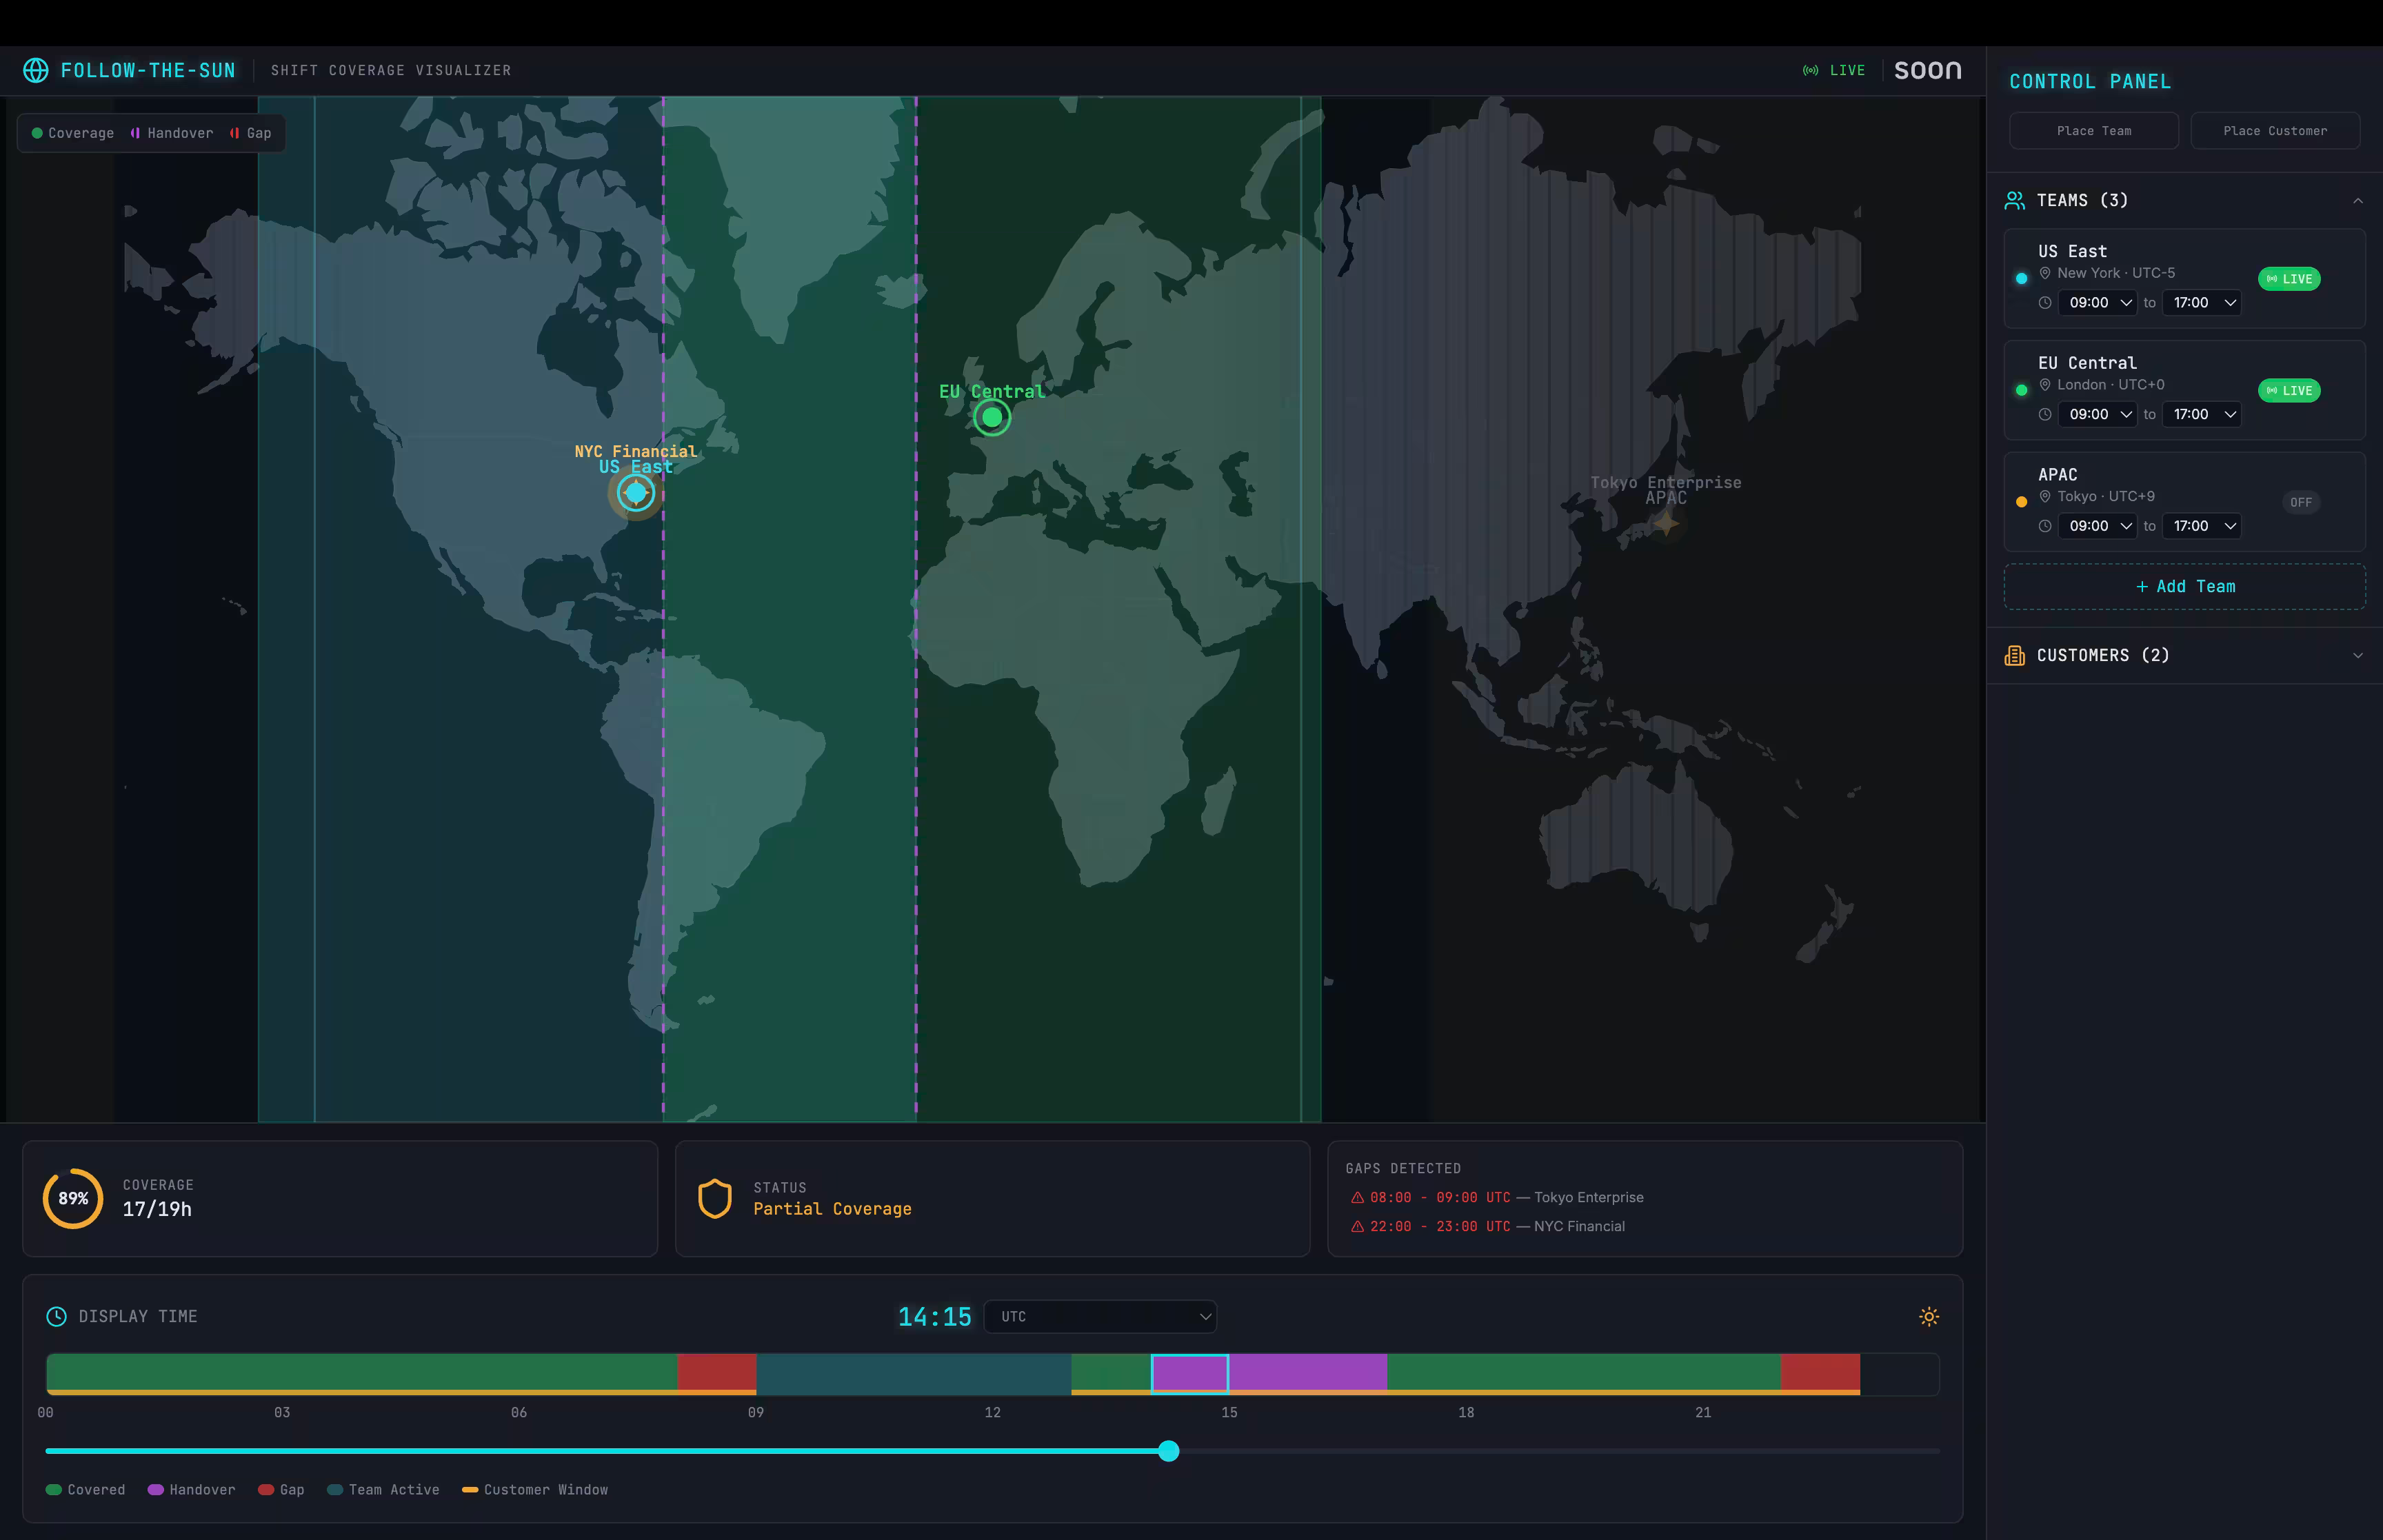
A Free Global Shift Coverage Visualizer
If you manage distributed teams, you should test your current setup.
We built a free Global Shift Coverage Visualizer that allows you to:
- Add teams by geographic location
- Define operating hours
- Anchor schedules in a single time reference
- Overlay customer regions
- Highlight overlap windows
- Detect uncovered periods
- Click directly into specific time blocks
Instead of asking whether you are covered, you can see it.
You can try it here:
It takes minutes to model your current structure and immediately reveals where risk exists.
Why Visualization Improves Operational Discipline
When leaders can see coverage clearly, decision making changes.
Managers become more intentional about overlap windows. Staffing discussions move from opinion to evidence. Shift transitions become structured instead of rushed.
Most importantly, accountability becomes clear.
If an incident occurs at 02:13 in the morning, you can identify:
- Which region was responsible
- Whether coverage was sufficient
- Whether overlap buffers were adequate
- Whether skill distribution matched demand
Without visualization, post incident analysis becomes guesswork.
With visualization, it becomes data driven.
When Visualization Is Not Enough
A coverage map identifies structural weaknesses. It does not automatically fix them.
As organizations grow, complexity increases. You must account for:
- PTO and sick leave across regions
- Rotating shifts
- Forecasted ticket volume
- Skill based distribution
- Escalation paths
- Compliance constraints
At that stage, manual scheduling begins to break down.
Modern workforce management platforms automate the logic behind global coverage. They ensure that the right number of qualified people are scheduled at the right time across regions.
Visualization exposes risk. Automation eliminates it.
If you want to understand how structural coverage mistakes translate into real financial impact, explore the hidden cost of poor global shift coverage.
Frequently Asked Questions
What is global shift coverage?
Global shift coverage refers to staffing teams across multiple time zones to ensure continuous operational support throughout the day.
How do you manage time zones in a distributed team?
The best practice is to anchor all schedules in a single time reference such as UTC, then translate to local time for each region.
How much overlap should global teams have?
Most resilient operations maintain at least 30 to 60 minutes of overlap between regions to ensure smooth handovers and context transfer.
Why do coverage gaps happen even with 24 hour staffing?
Coverage gaps often appear during shift transitions, lunch breaks, daylight savings changes, or when skill distribution does not match demand.
What tools help visualize global shift coverage?
Time zone aware coverage visualizers and centralized workforce management systems provide real time insight into regional staffing, overlap windows, and uncovered periods.
If you manage global operations, the question is not whether you are scheduled for 24 hours.
The question is whether you can see your coverage clearly.
If you cannot see it, you cannot optimize it.